
What does rotki offer?
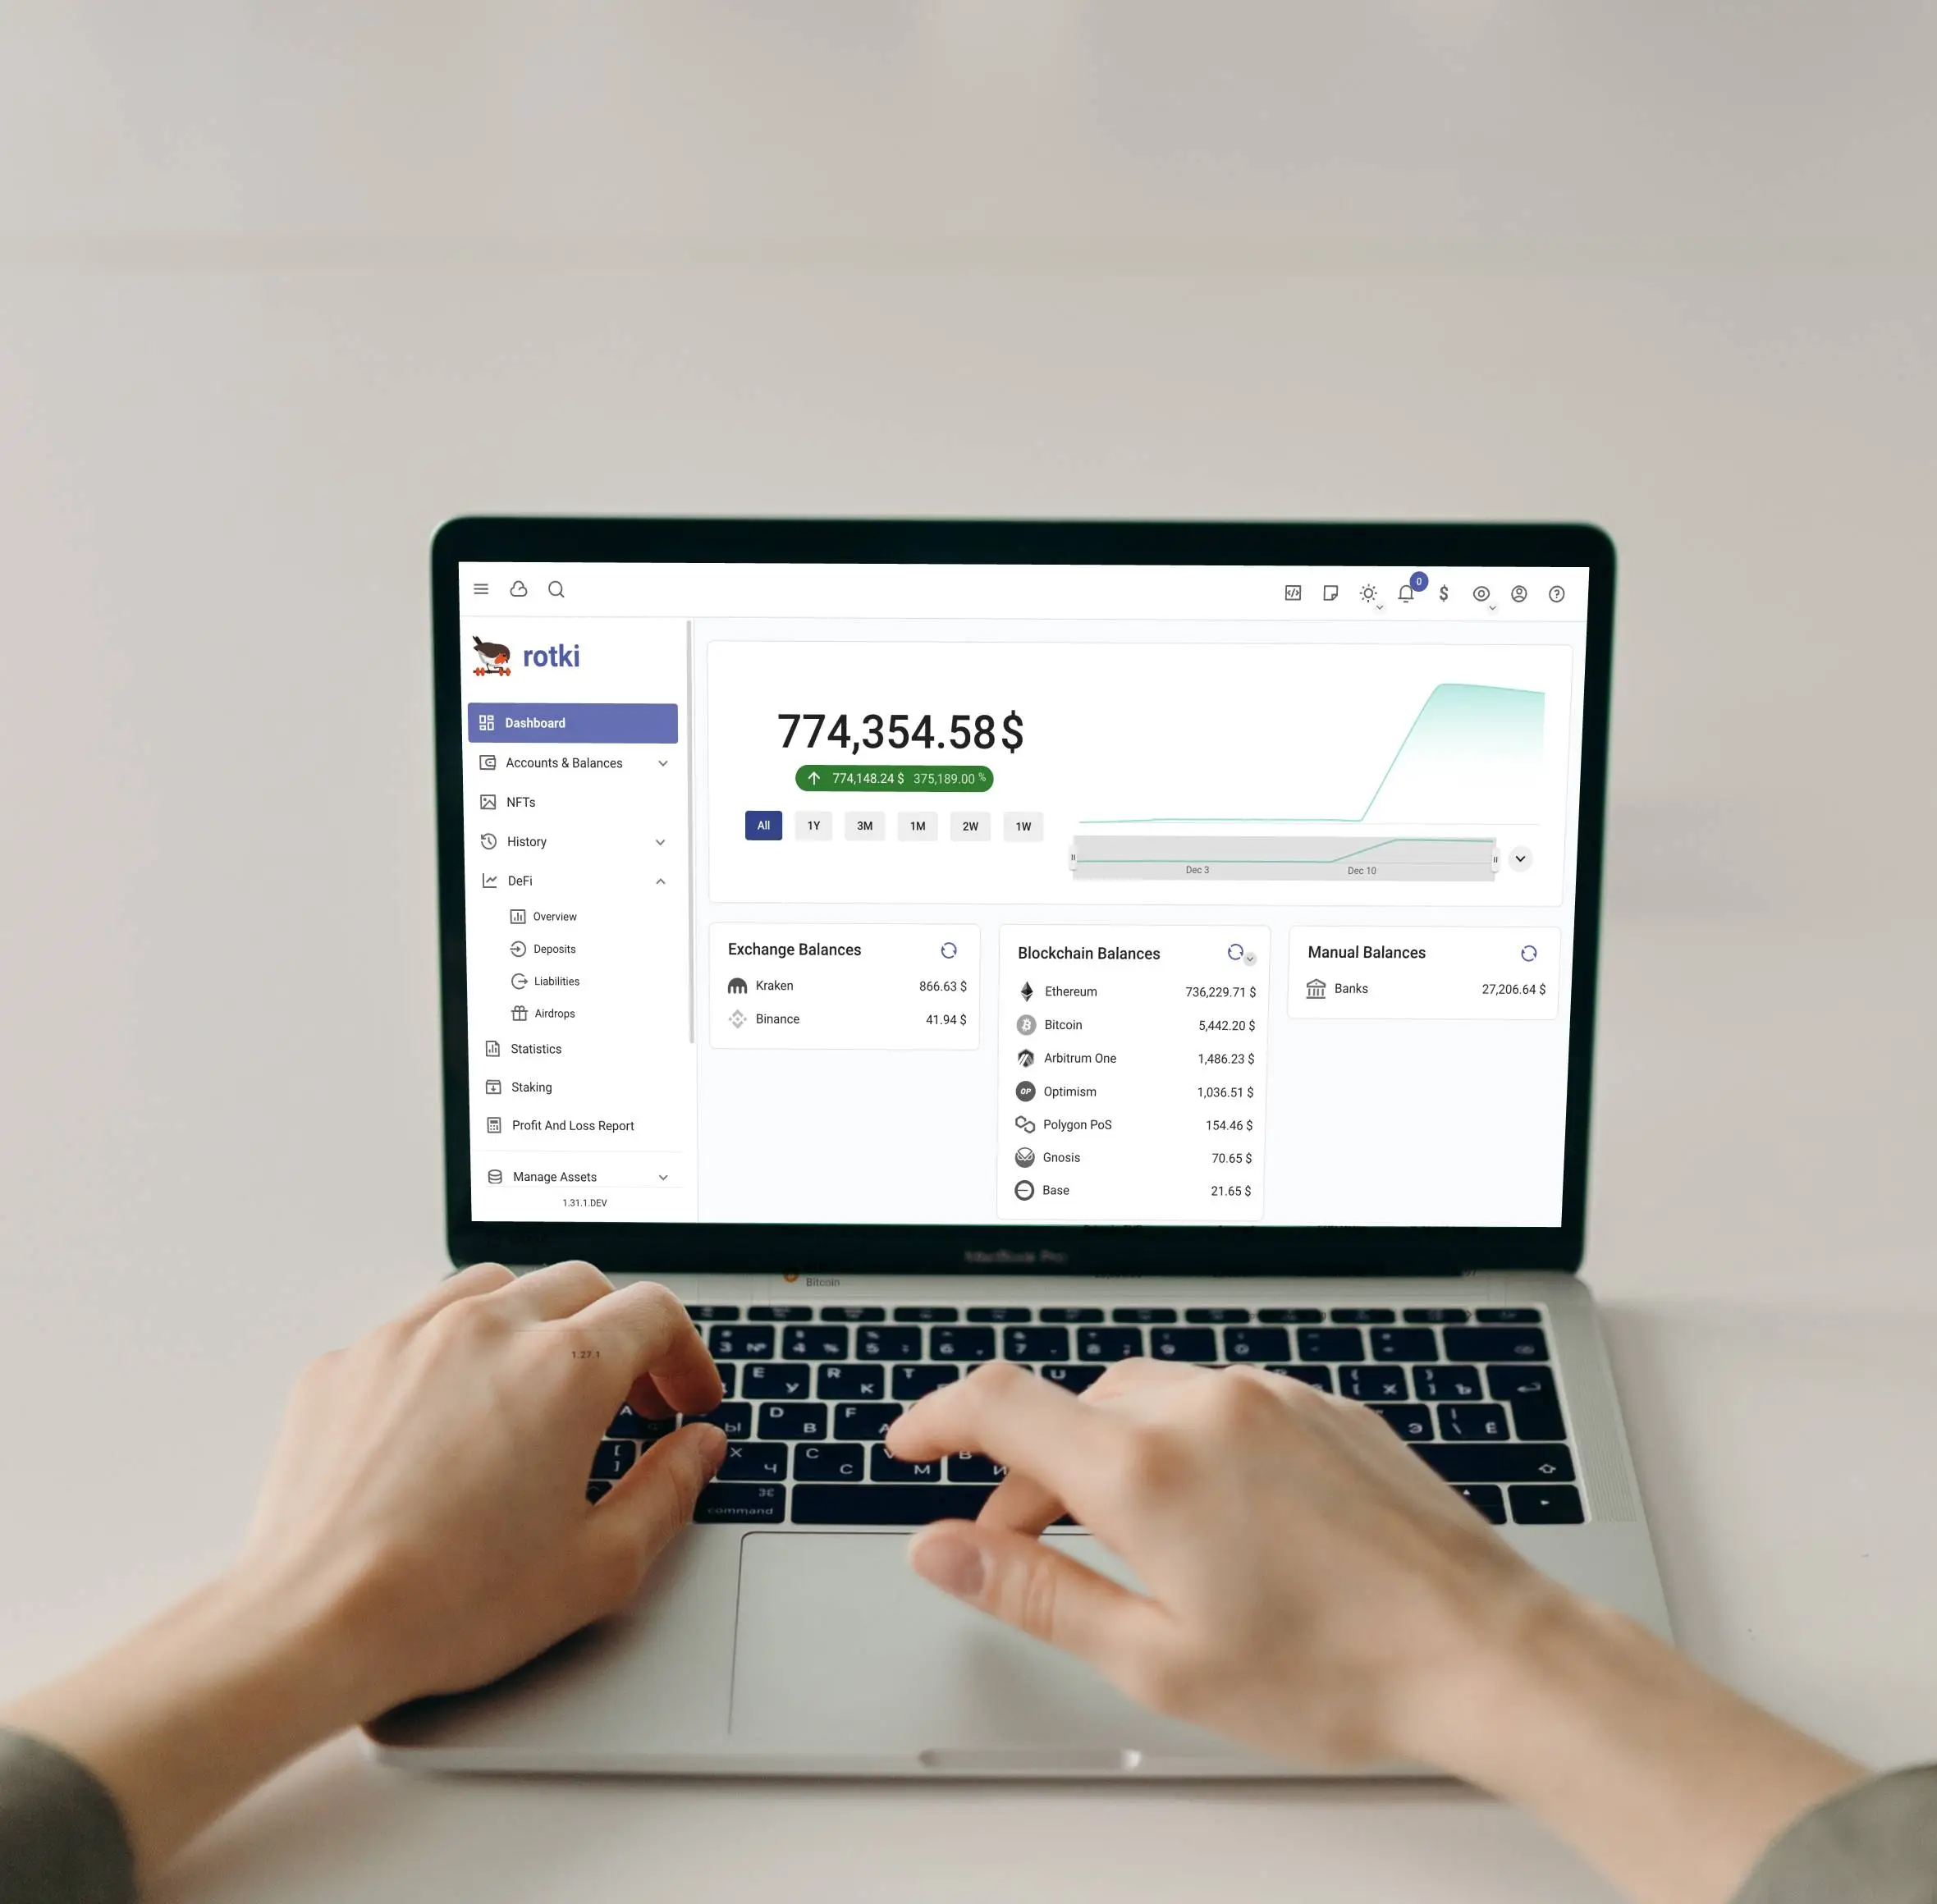
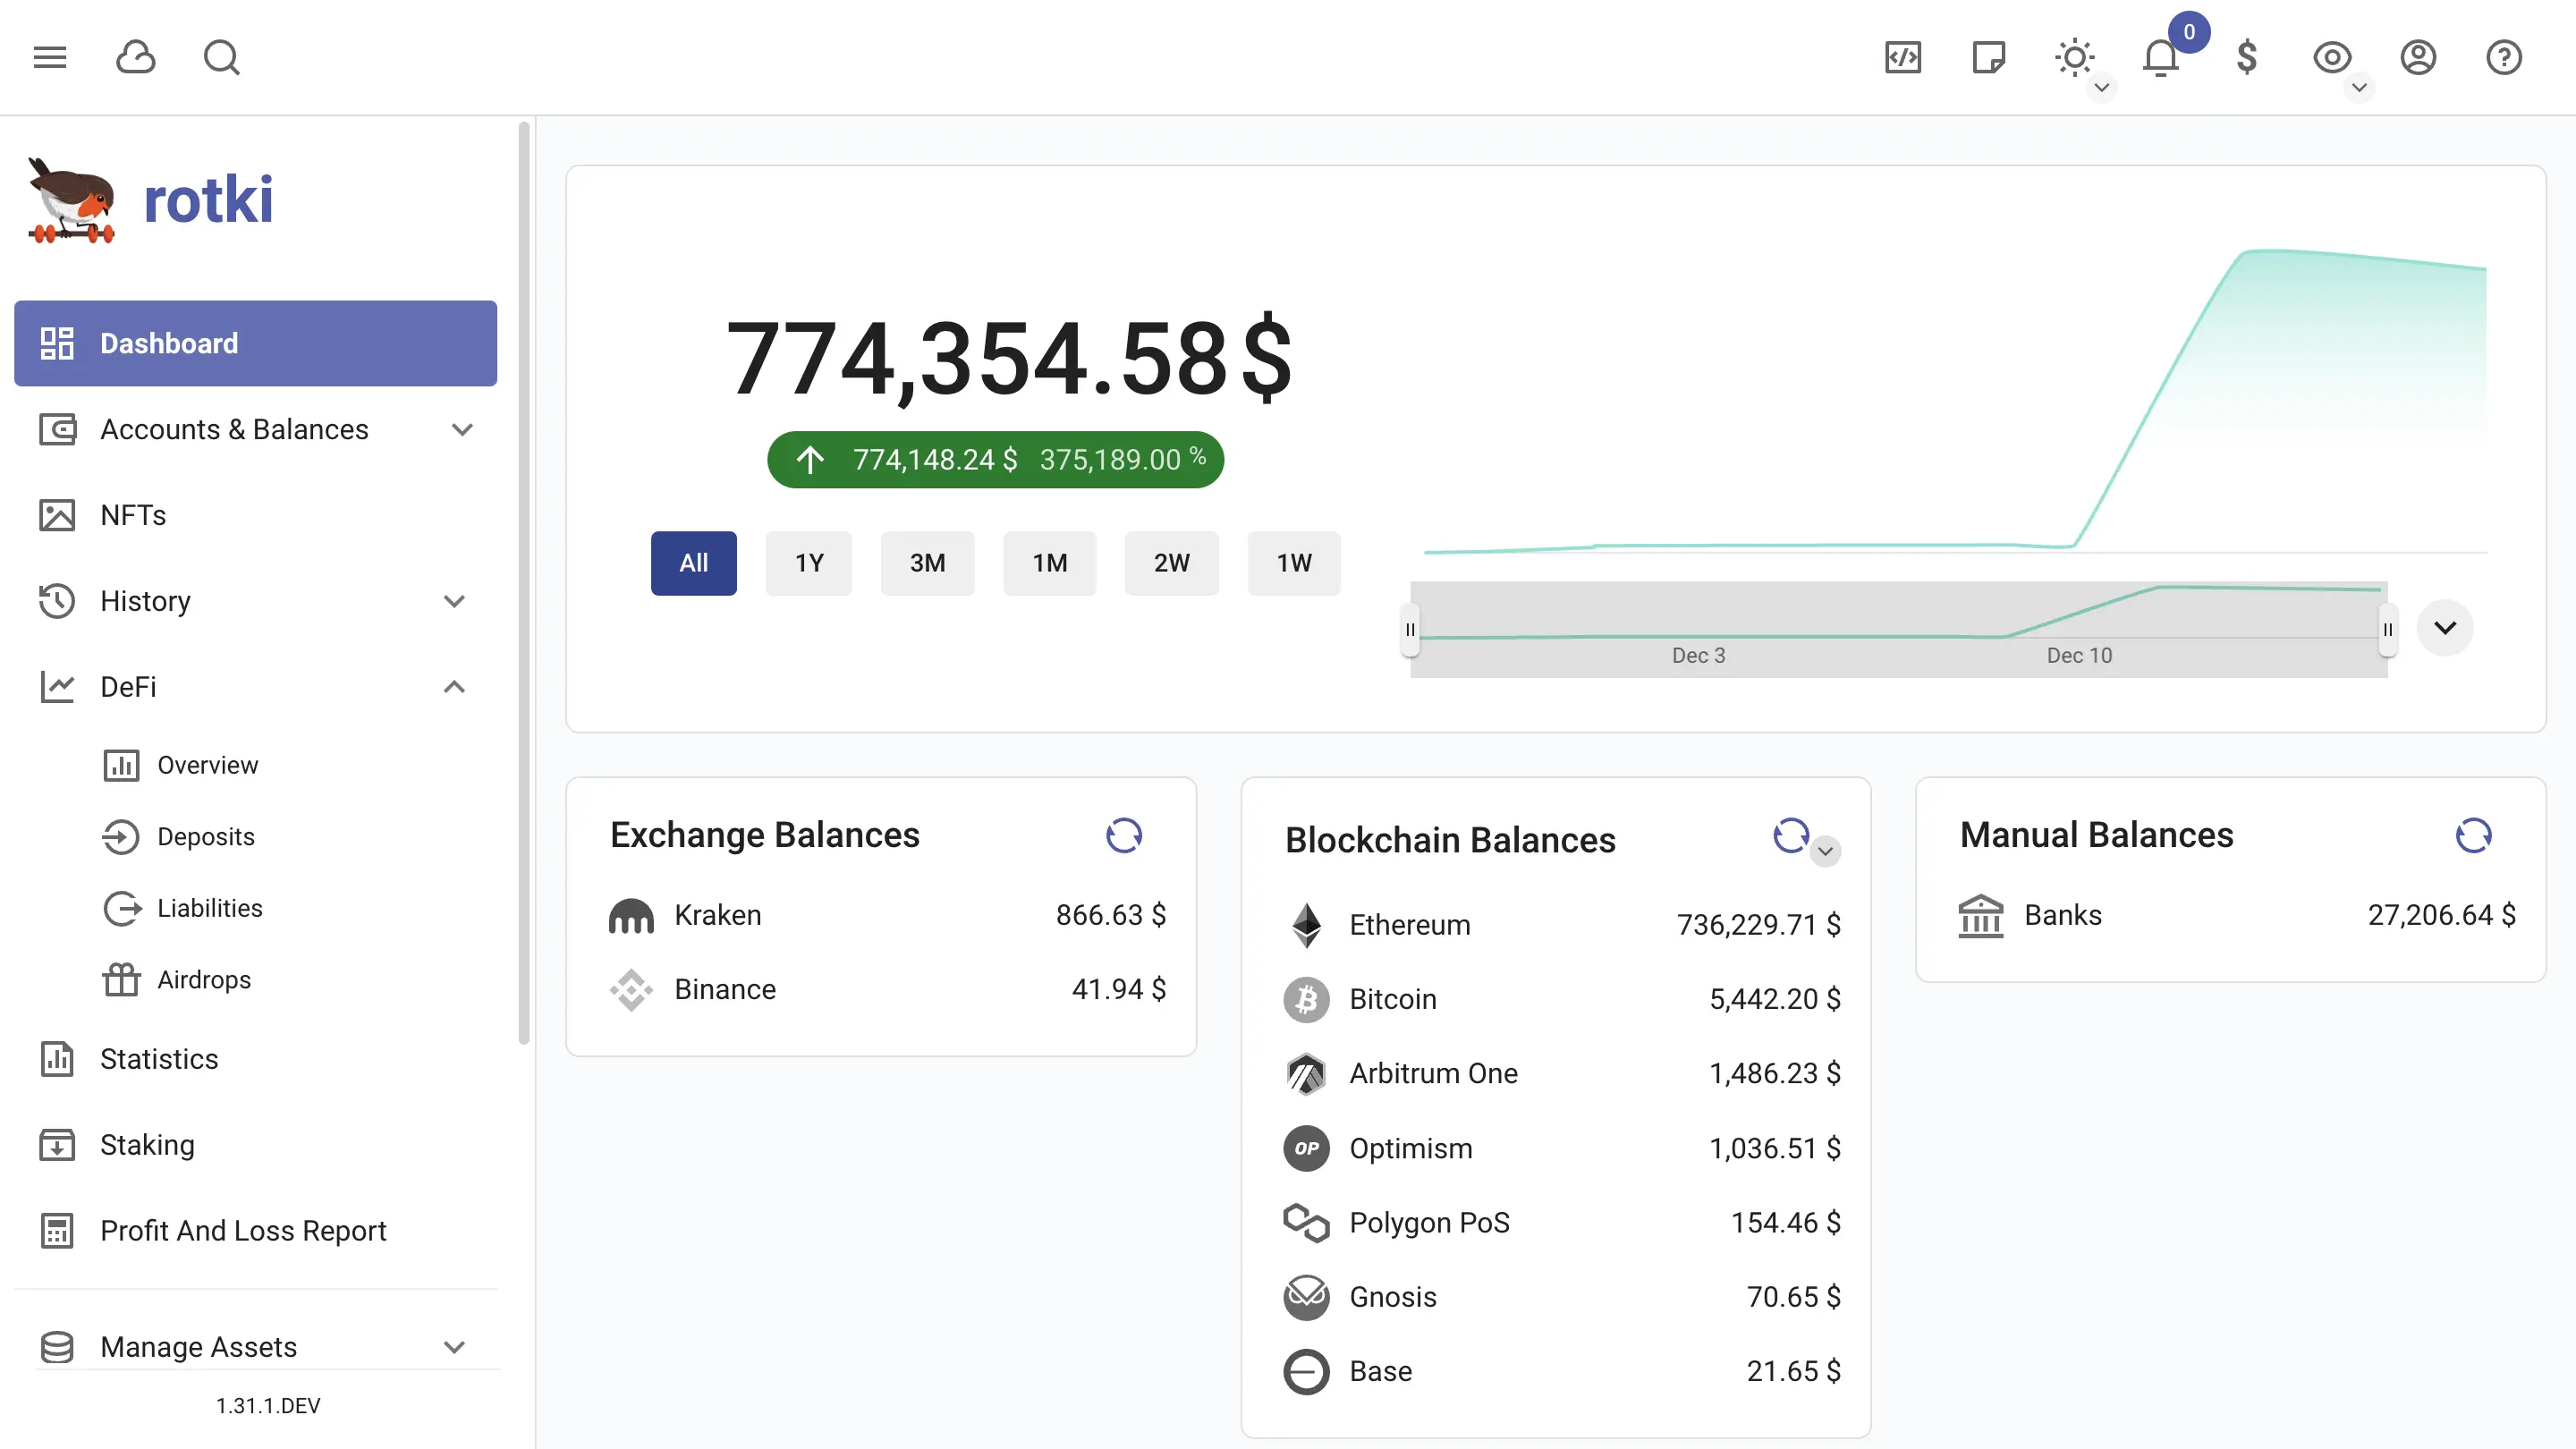
Dashboard
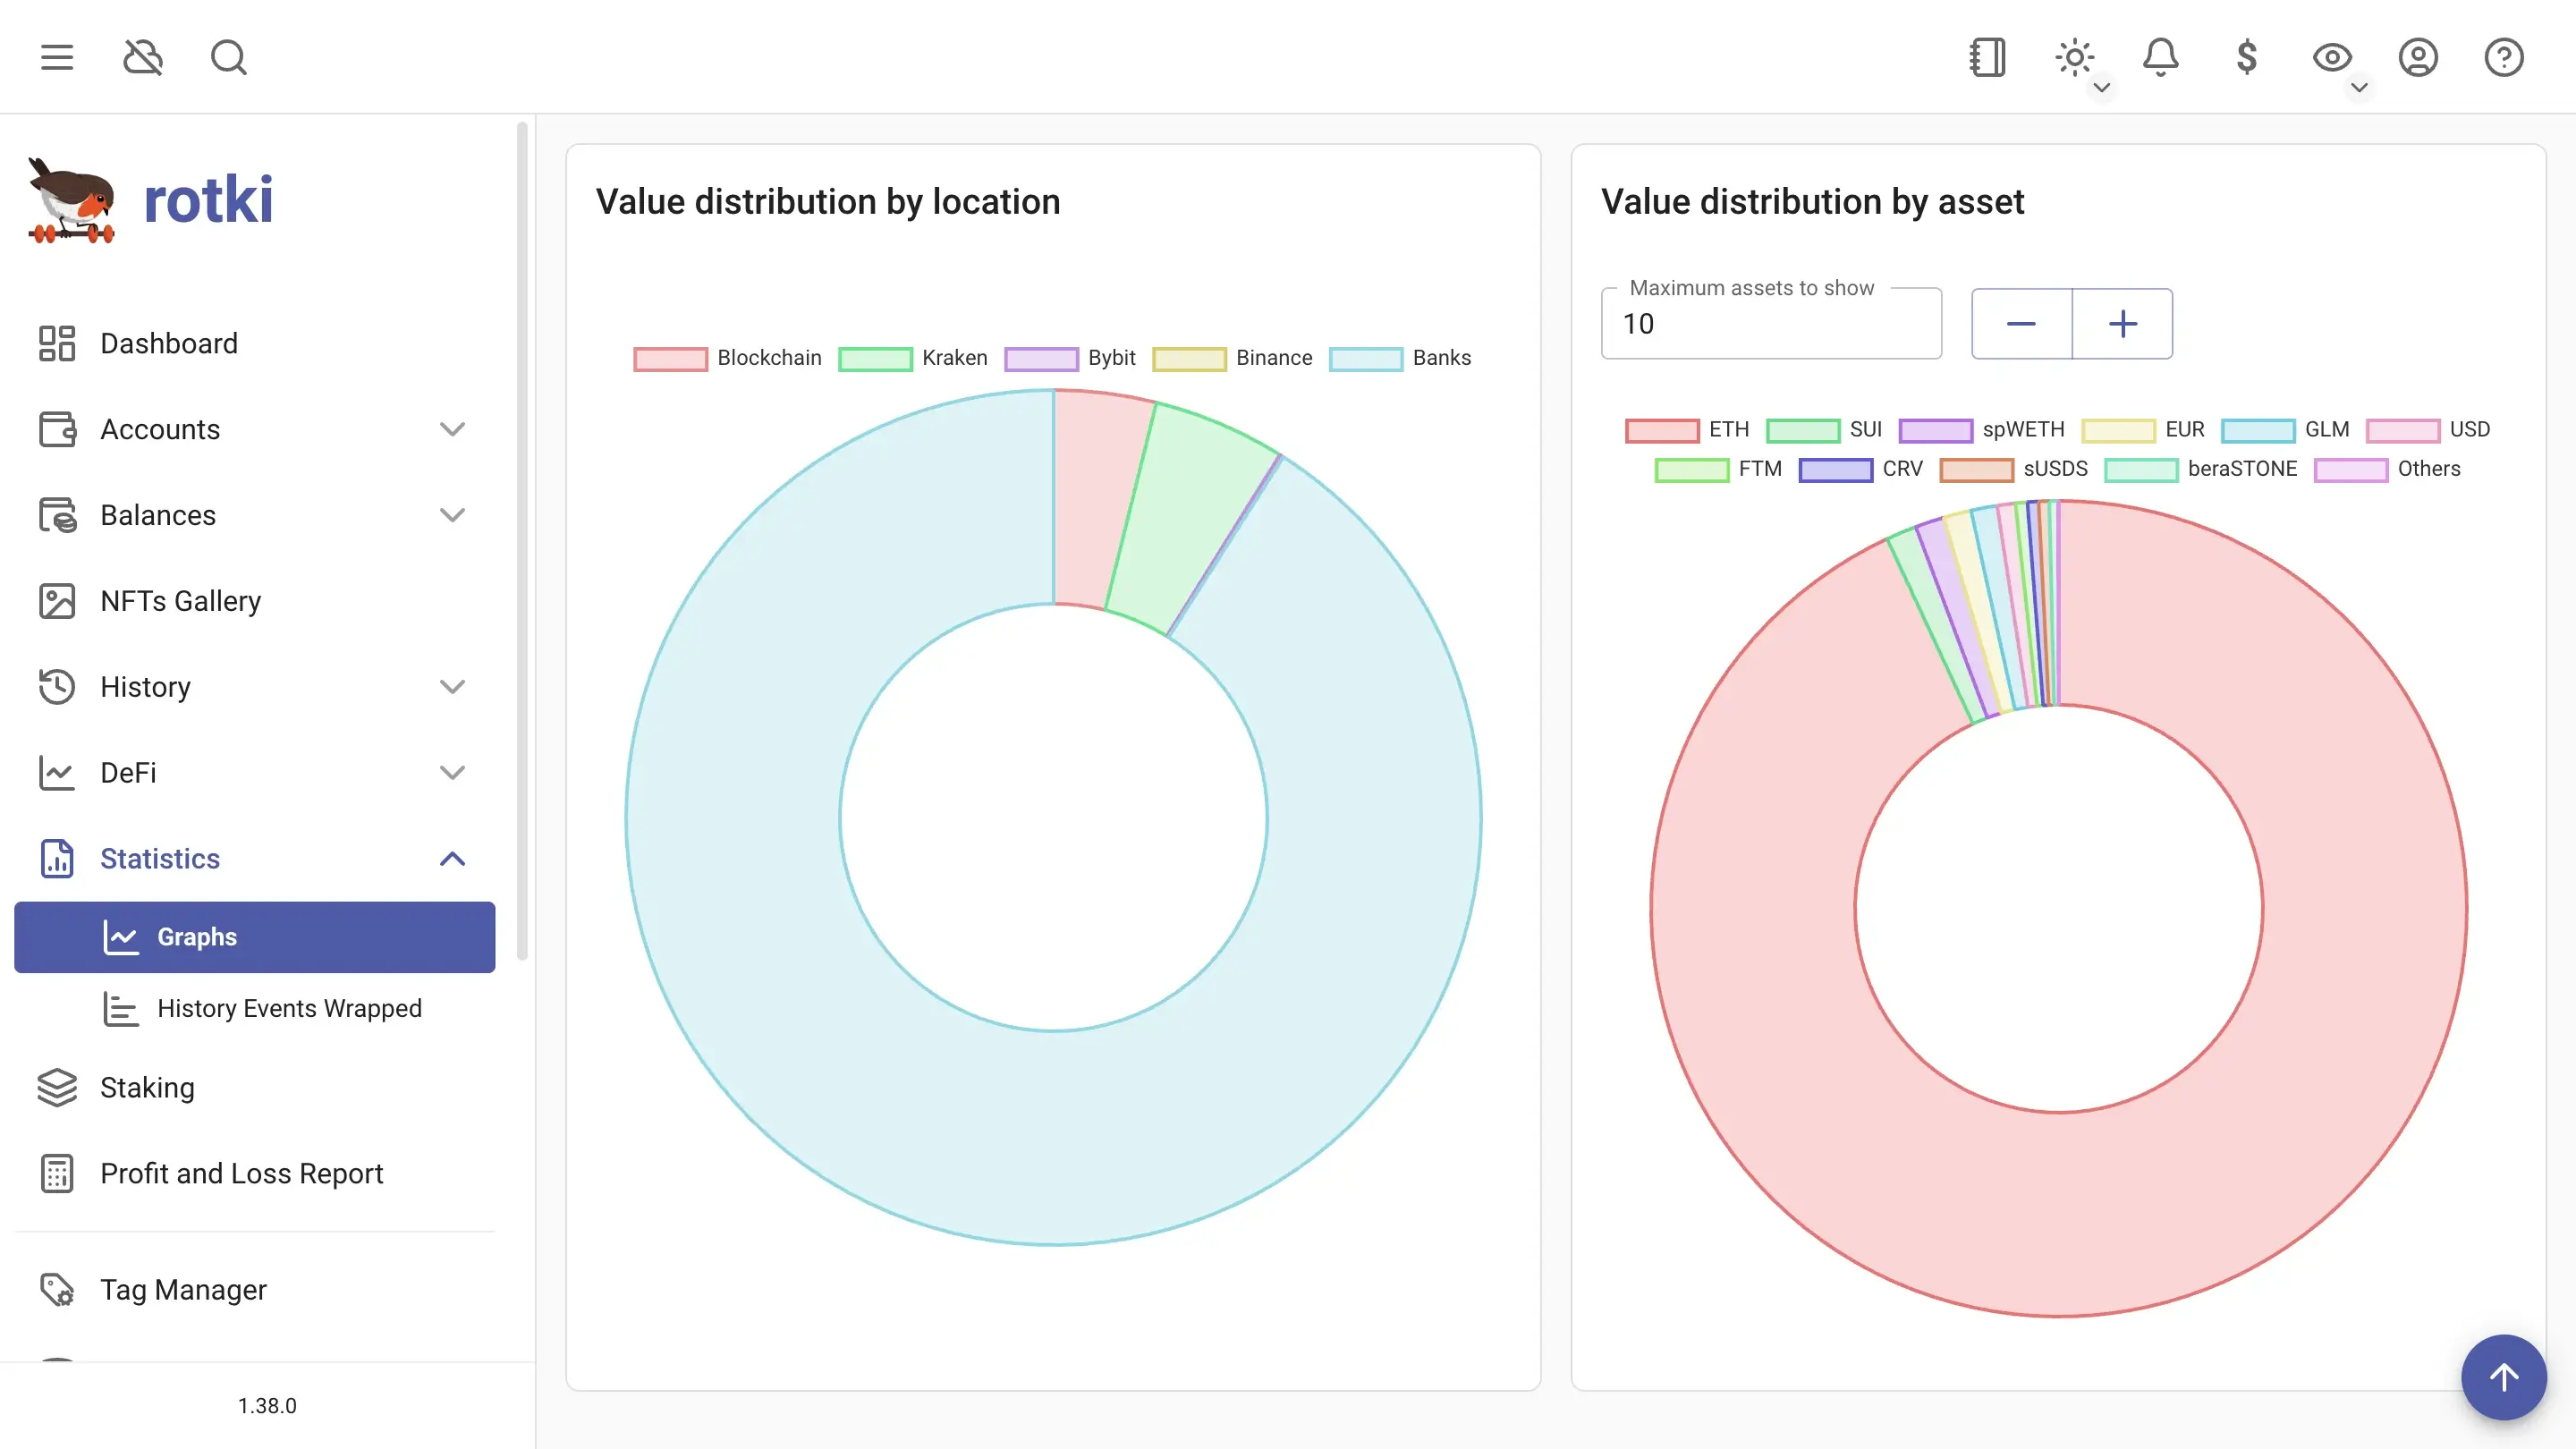
A 360° overview of your assets
I think my identity has been stolen at every crypto tax product I have used over the years. Finally bringing the data under my control with Rotki and using the API with an agent to prepare cost basis and taxes this year was a breath of fresh air. This is the way.
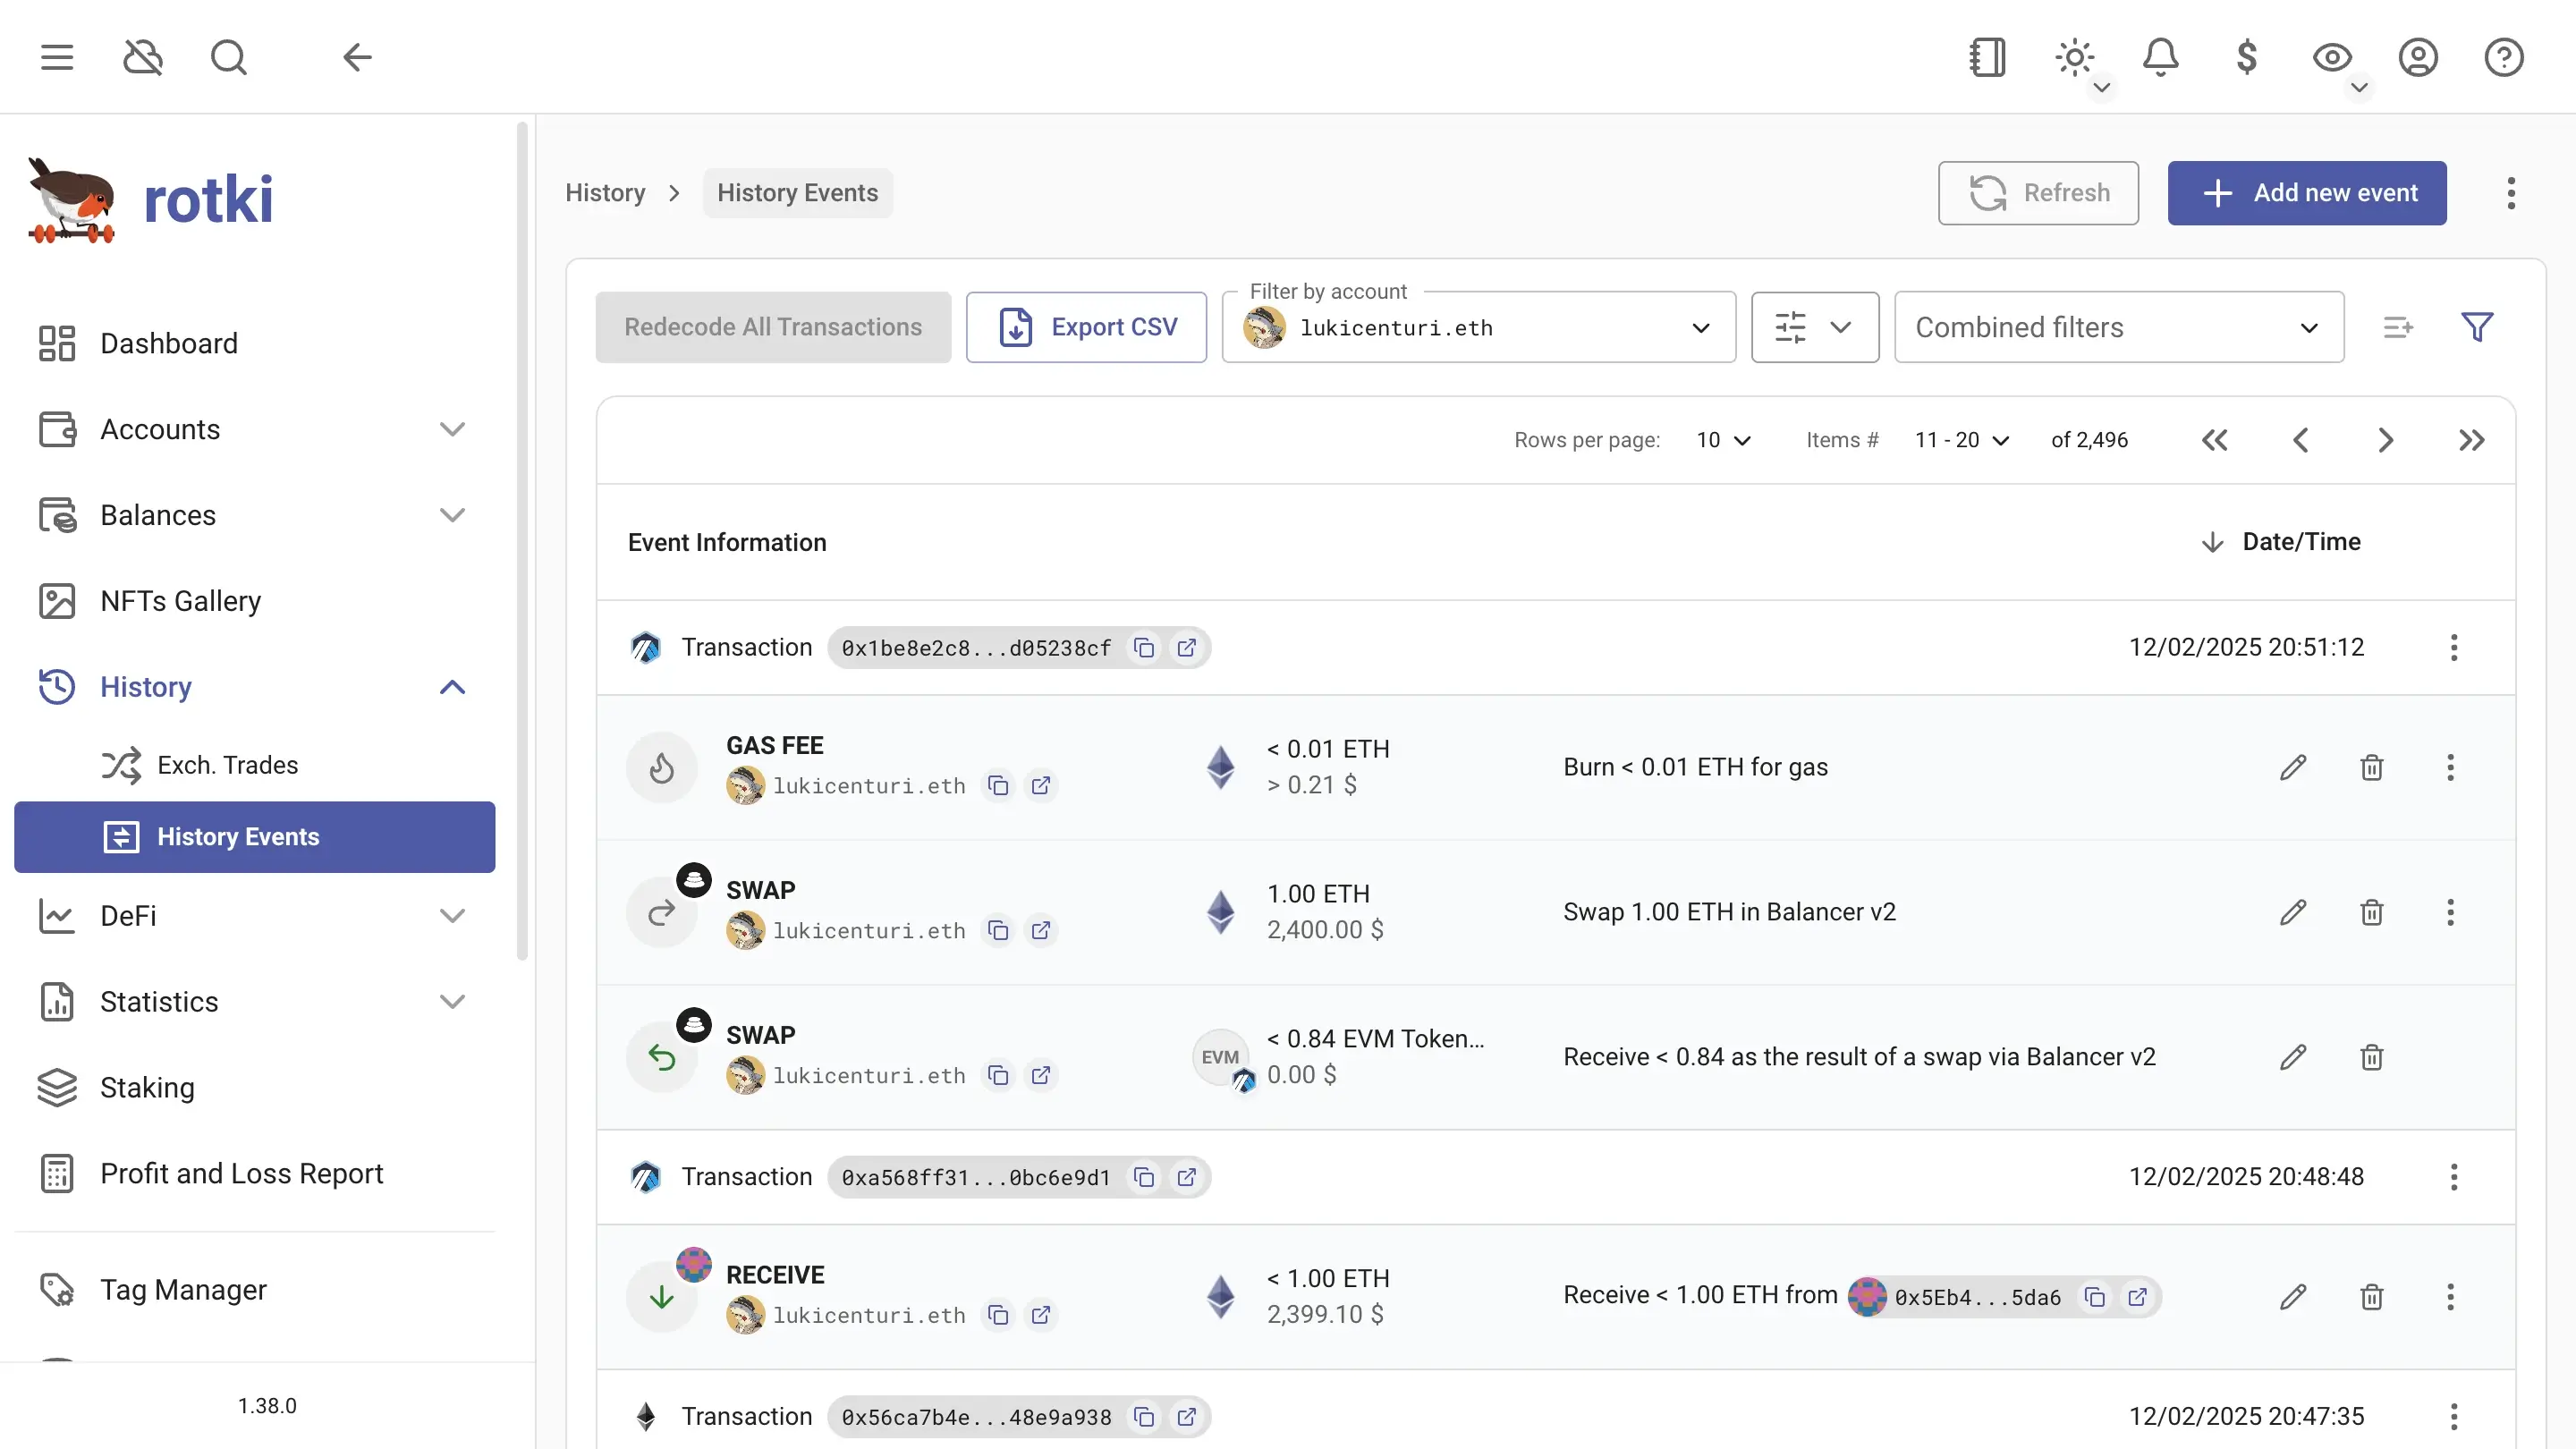
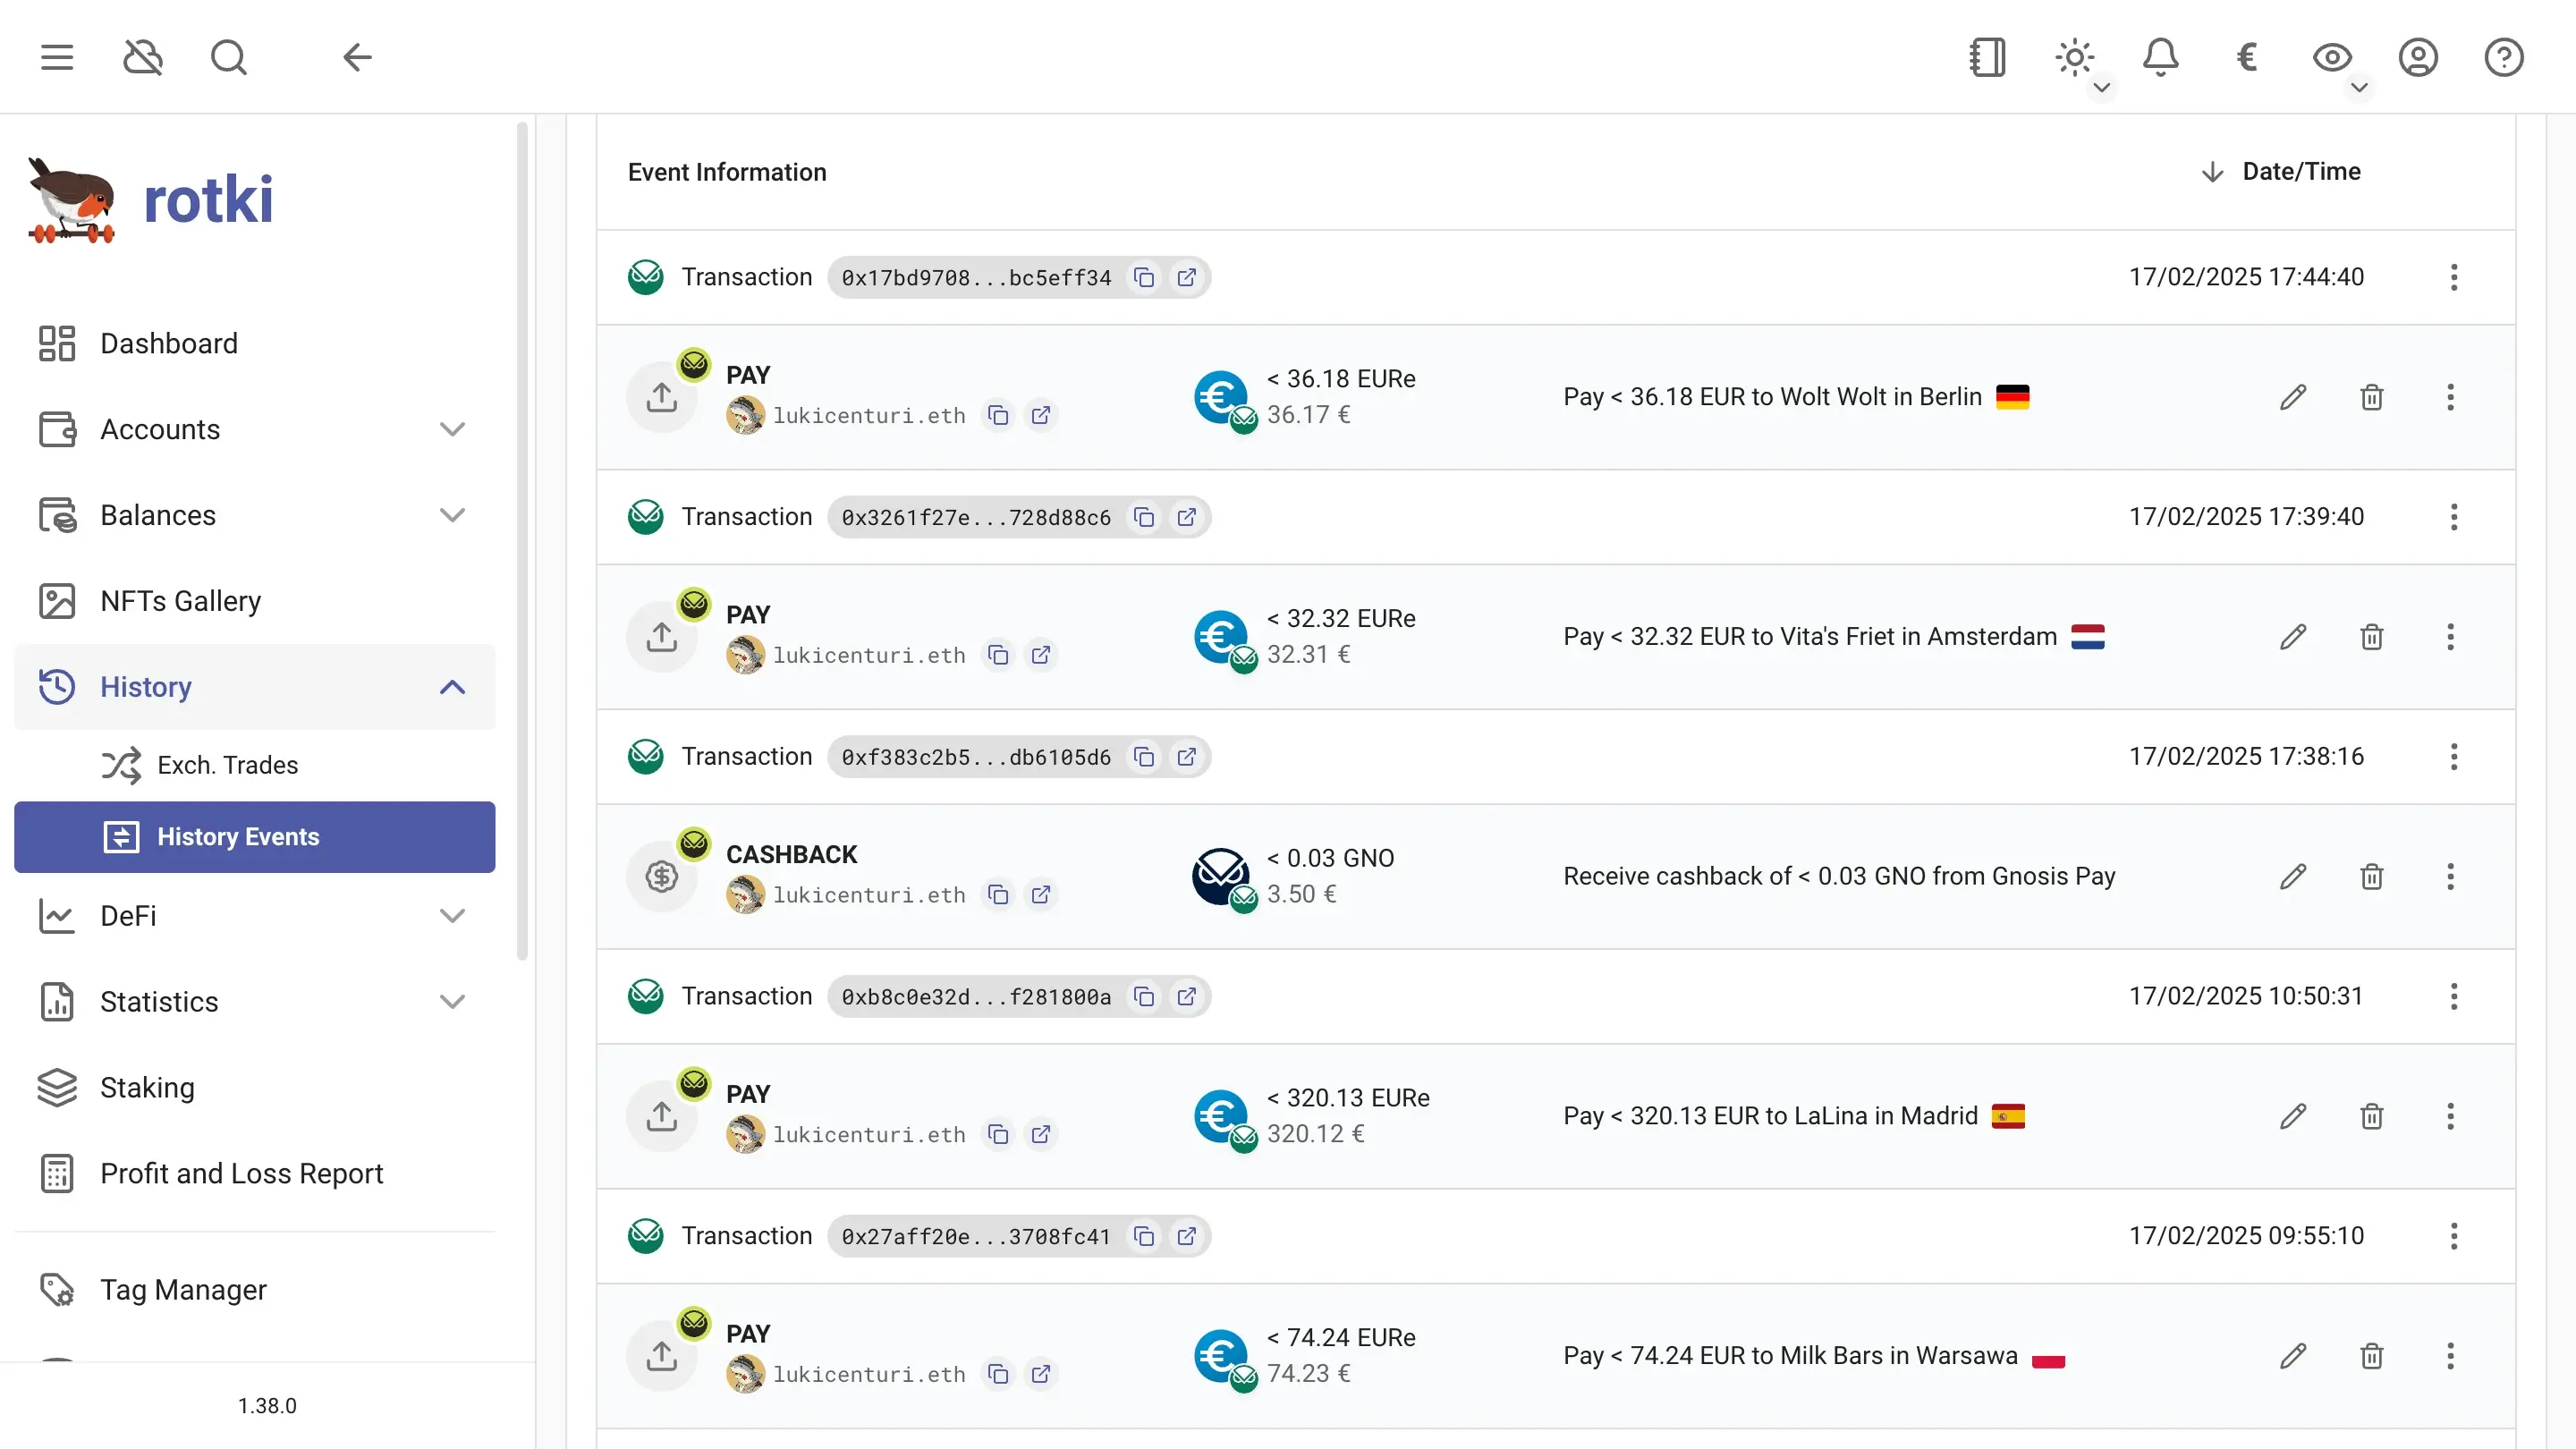
I highly recommend @rotkiapp, especially if you are a @gnosispay and @monerium user. I was able to categorize all my company's 2024 onchain transactions for my tax accountant in a couple of hours. This would have taken me at least 2-3 days without rotki.
Try @rotkiapp if you're looking for a private way to manage your crypto portfolio without sharing your email/data with an external accounting SaaS.
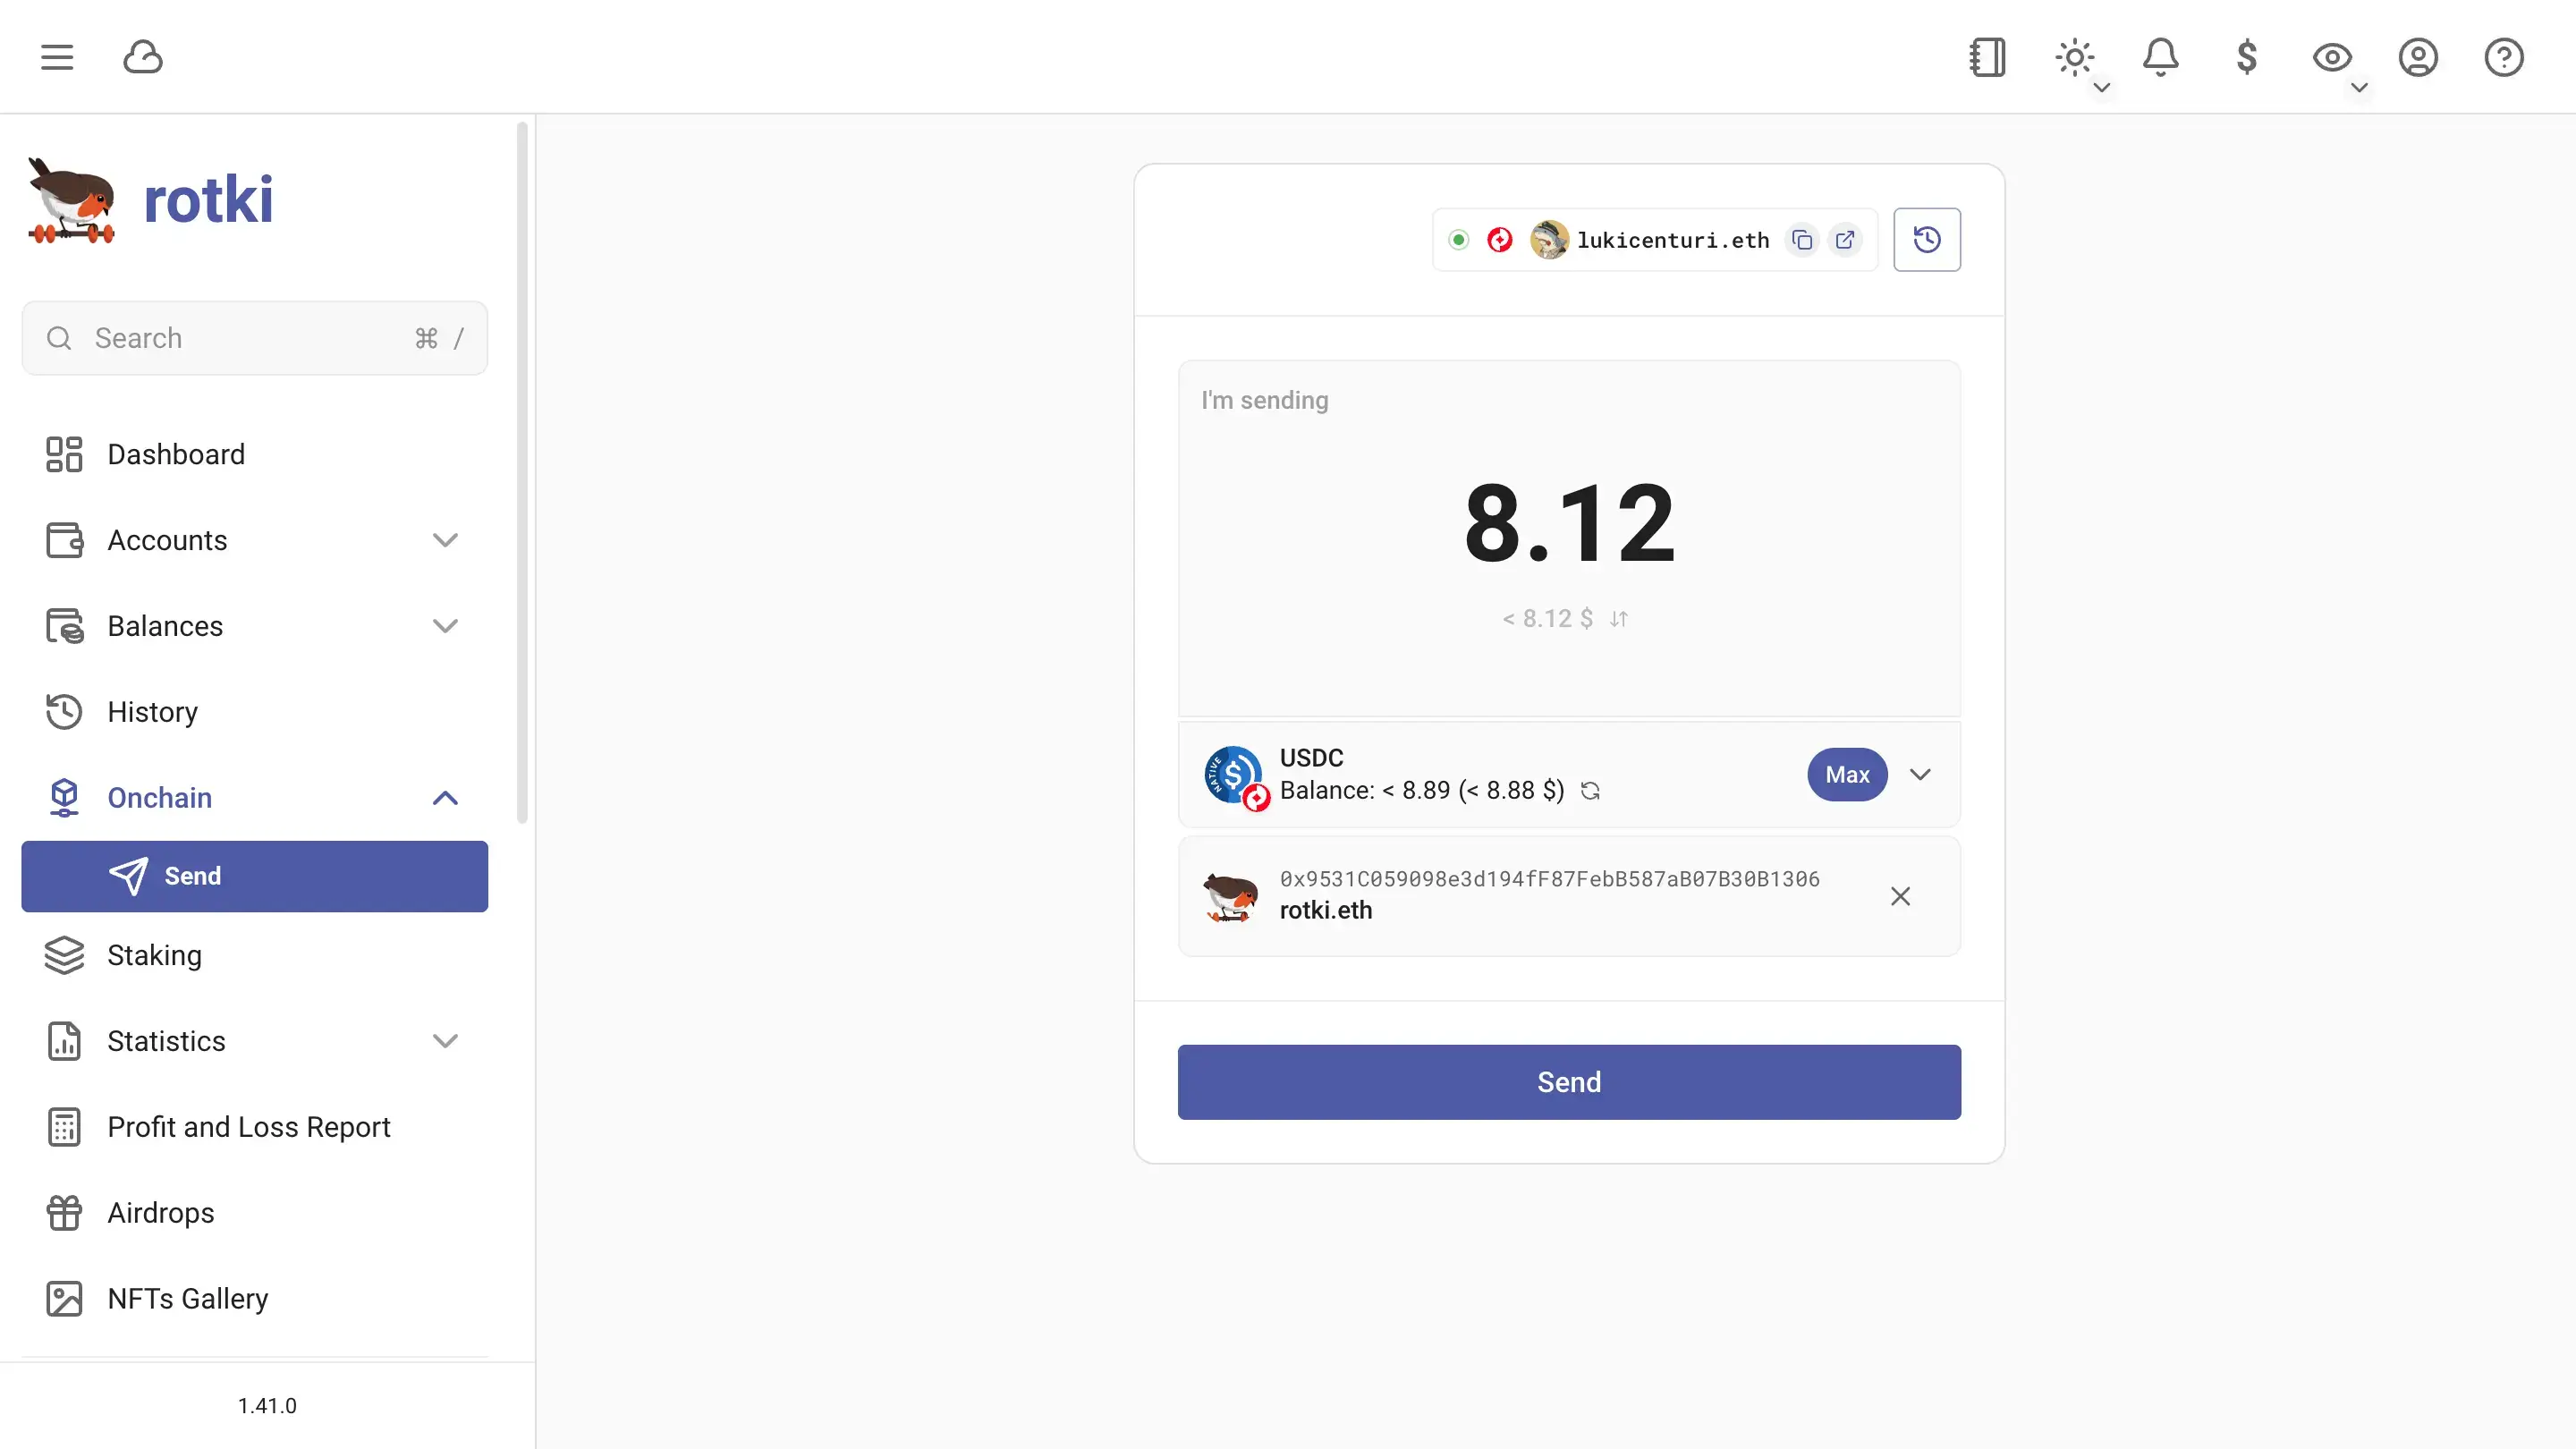
No email needed to create an account as it runs on your local machine. It allows you to aggregate multiple sources e.g. EVM/Bitcoin accounts (works w/ ENS too) and all major CEXs.
Can also help you identify any unclaimed/missed airdrops or generate PnL reports for accountability purposes.
And it's all open-sourced!
Take a look at @rotkiapp they spend a lot of time creating an awesome open source app and deserve more love than they get. 🥰
Rotki has a wholesome team providing the crypto industry with the most comprehensive accounting and portfolio tracking tool, all while protecting your privacy. Simply the best!
Me dropping everything, updating my local @rotkiapp and trying the @loopringorg integration.
Yeah, you should get your hands on this wonderful open source software. It’s just awesome 👏
Just tried @rotkiapp! So far it's the best portfolio tracking app I have used. I also love that its open source. Awesome work @LefterisJP
Awesome If you haven't tried @rotkiapp then give it a go. There's a free version, but you'll want to go Premium after trying it. Rotki gives you control and the after sales is great too.
I use @rotkiapp because it is the only #crypto accounting and tracking tool that is 100% focused on privacy.
You can actually prove that.
When I found it I had to interview @LefterisJP to hear his story and you can too. https://youtu.be/AwMkOJQbhTY
Constantly amazed at how useful @rotkiapp is.
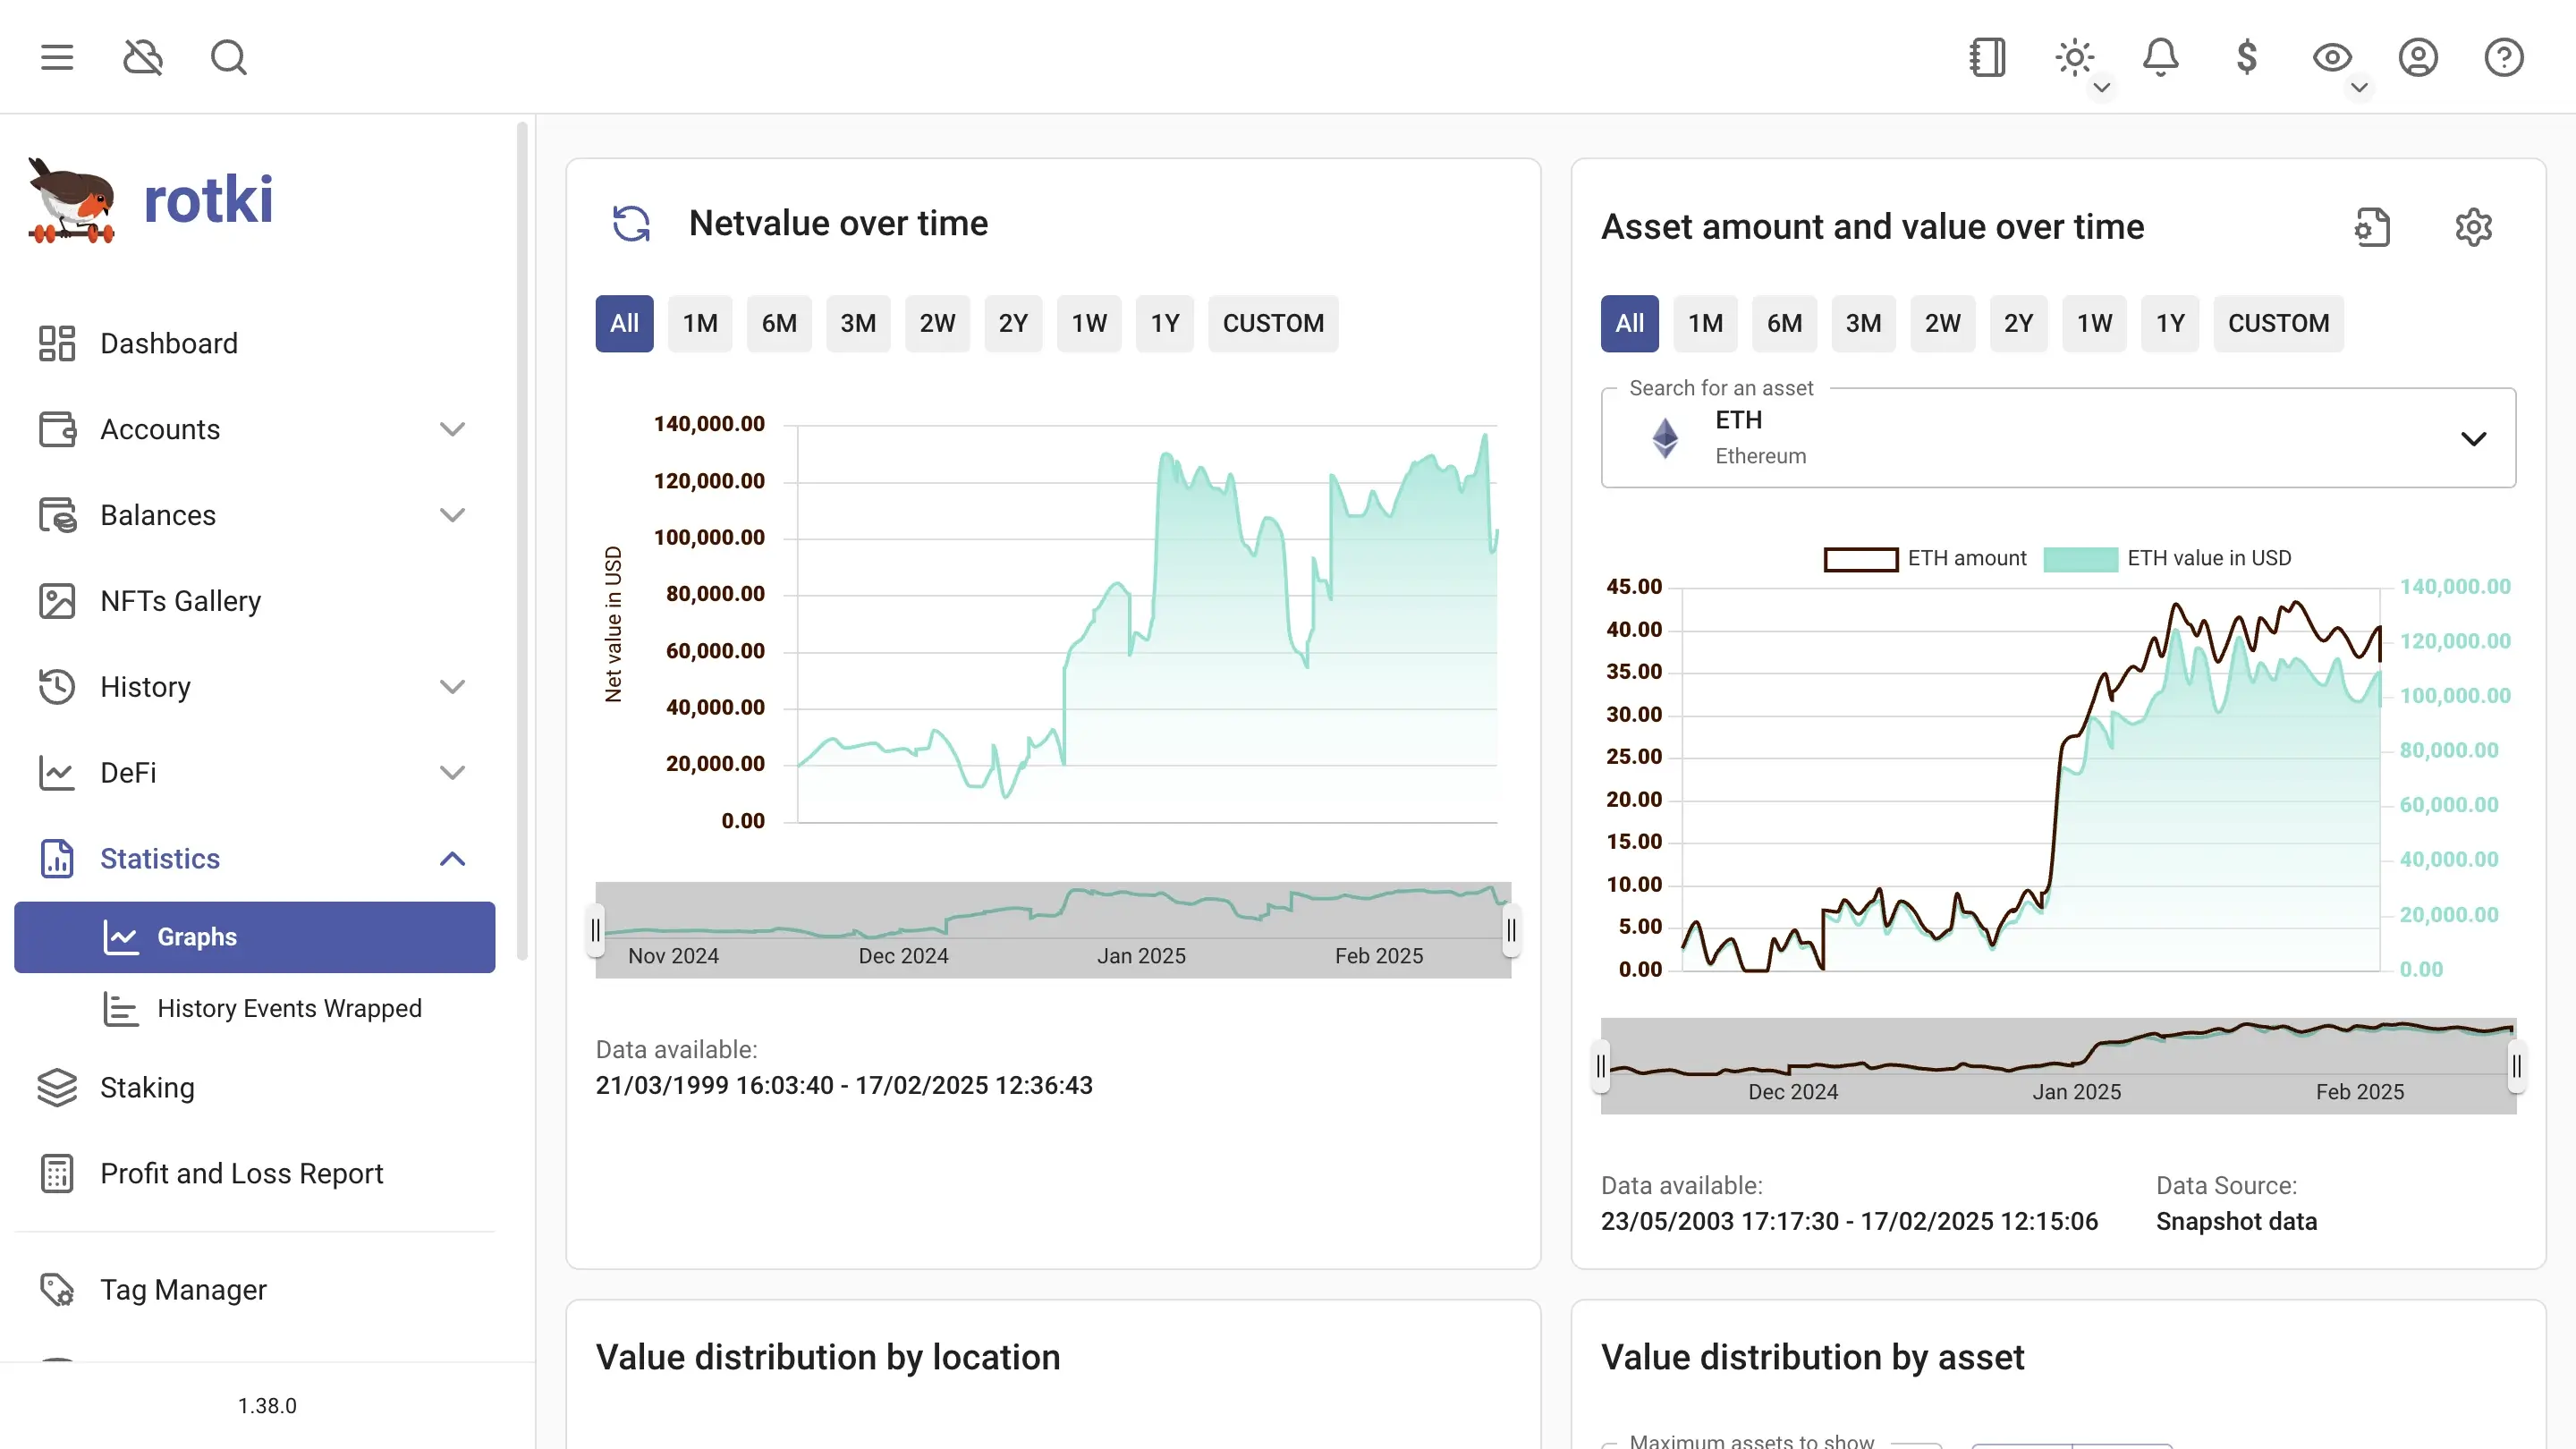
Aggressive releases; deep portfolio tracking; private and local; finds your forgotten farms.
Check it out and then buy a license. It's cheap as hell and if it finds you a couple airdrops, will pay for itself 100x over...
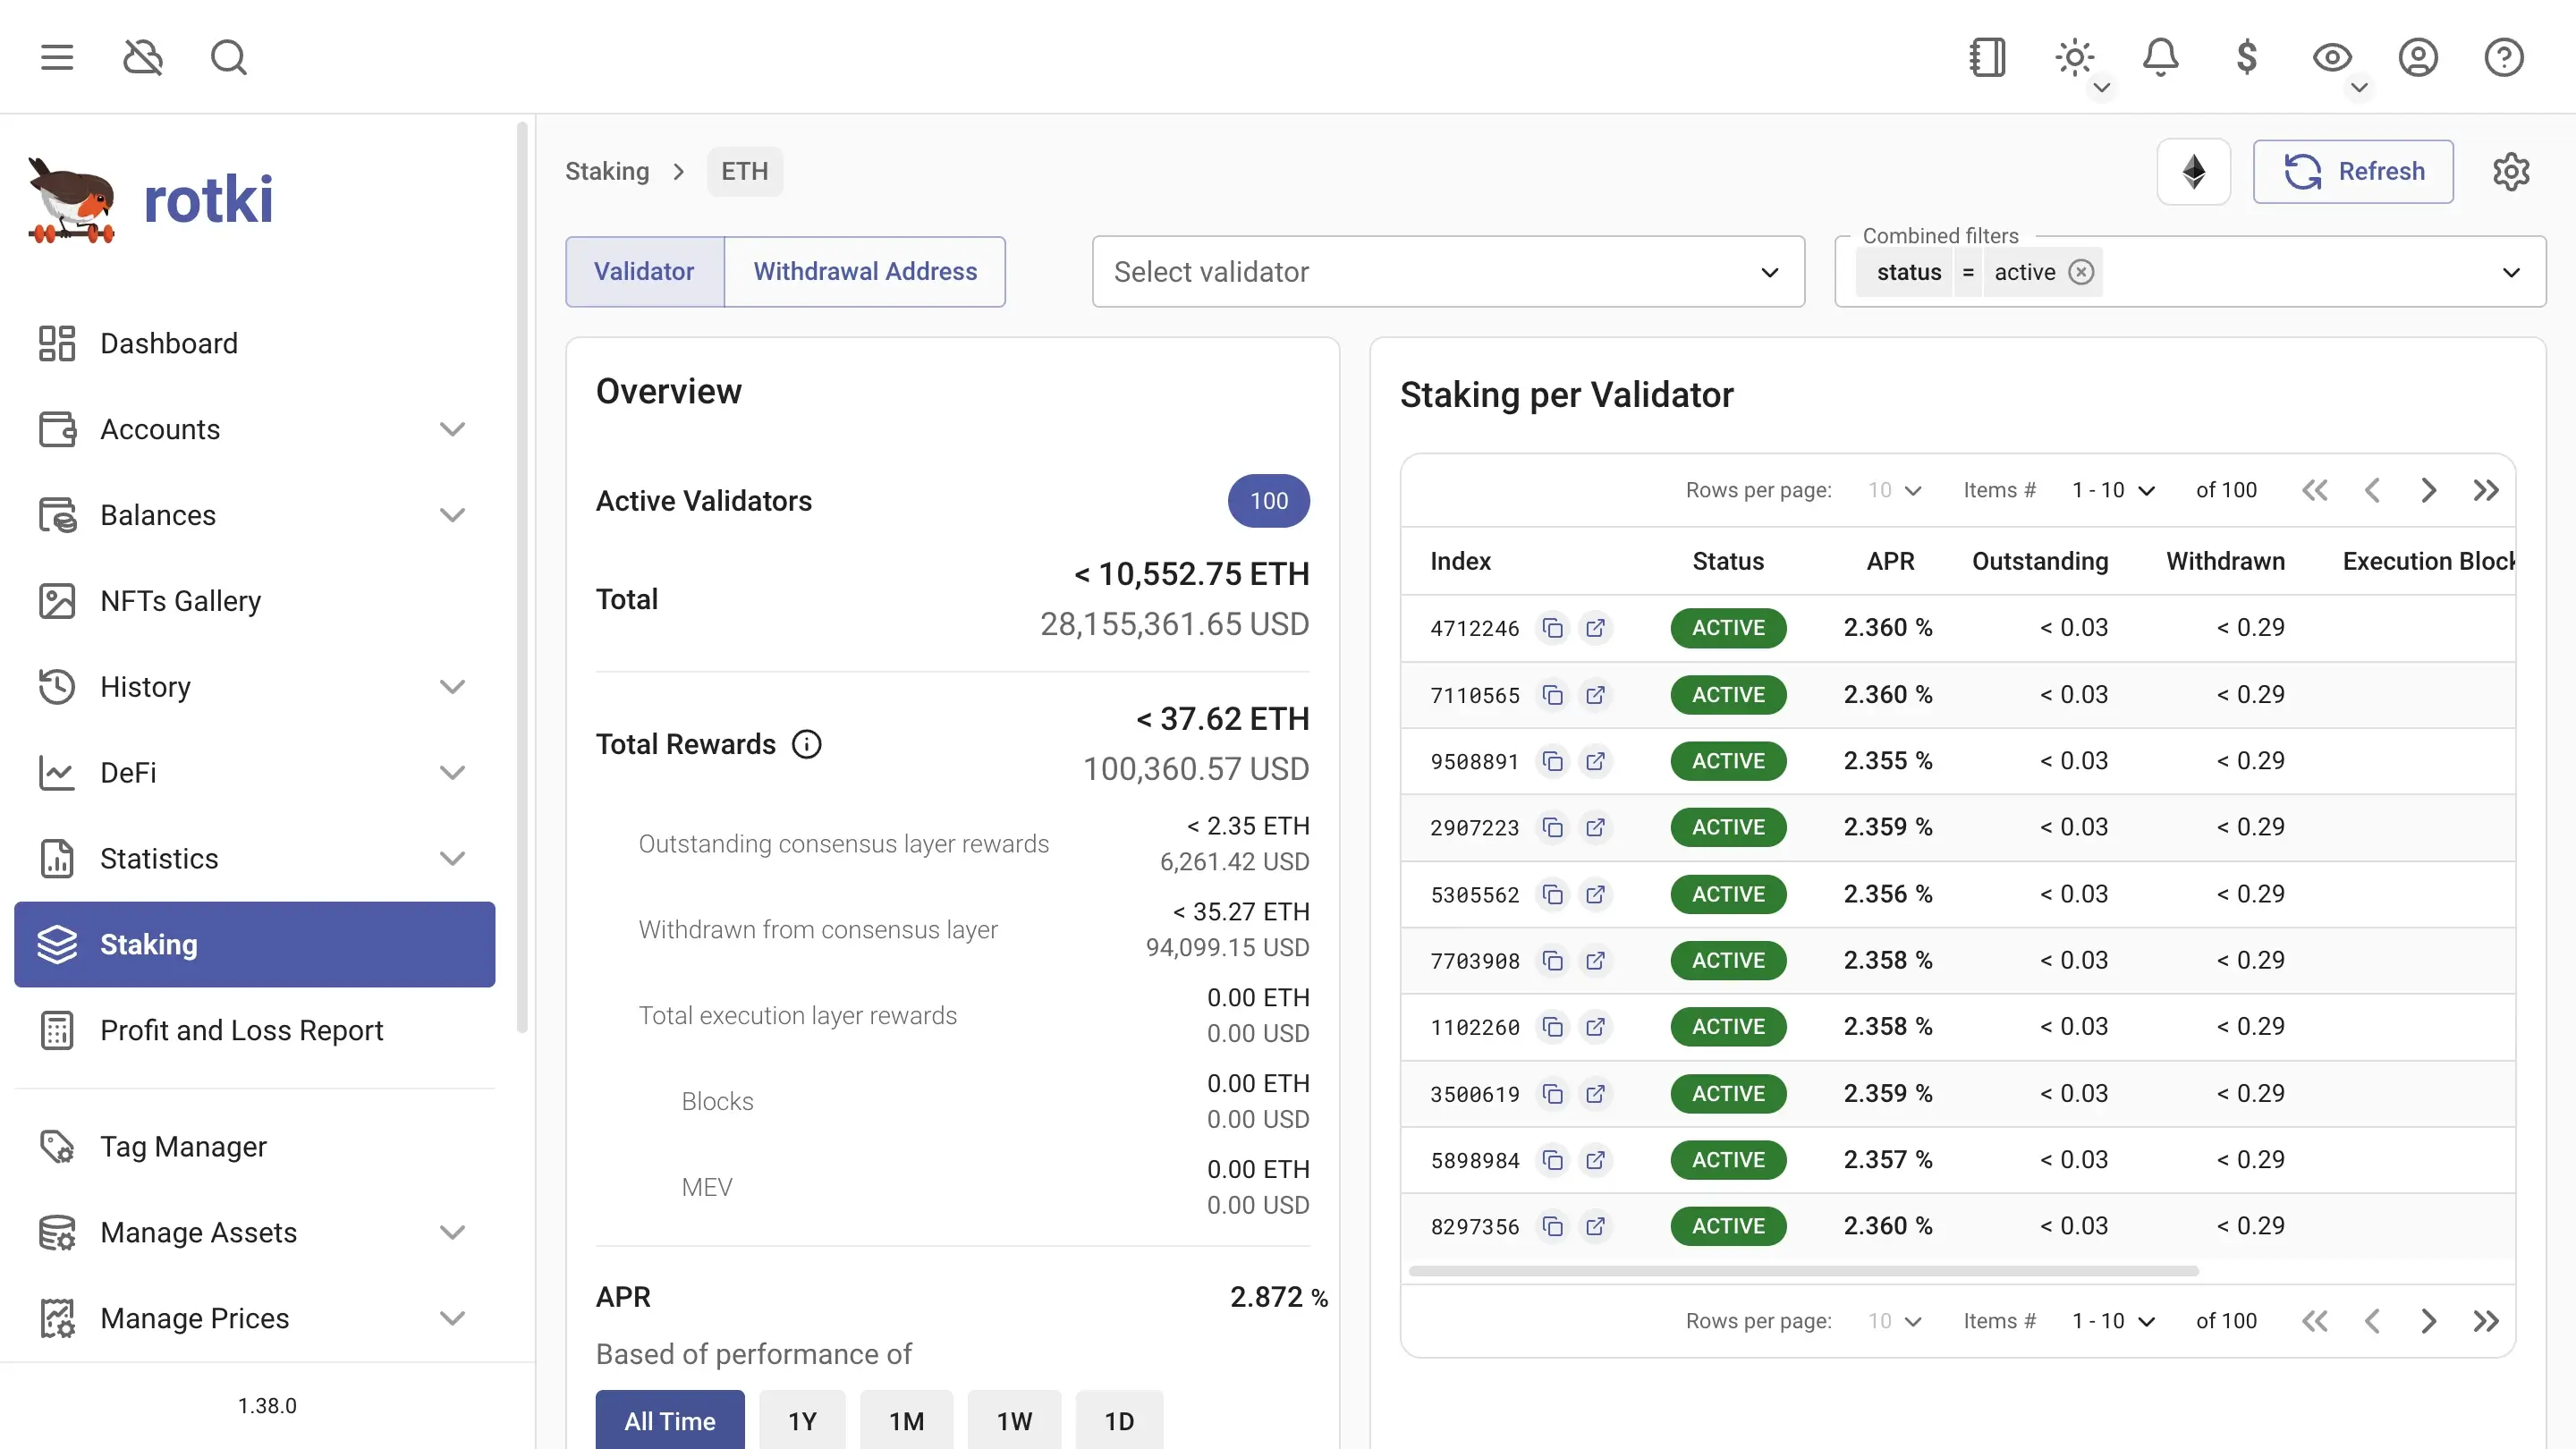
Rotki is by far the best software to track positions and holdings across different chains and prepare for tax season where rules are different in most countries. Most tax software fails miserably to detect or recognise various actions and tokens, unlike Rotki.
I don't trust these crypto accounting SaaS providers with my data. They will literally see all your wallet addresses, including your real home address. No way I'm gonna PAY to give it to them!
That's why I use Rotki!